UK & Europe – attractive markets for innovation and investment
The latest figures from the EPO show that EU-28 member states filed 3.8% more European patent applications in 2018, showing their strongest growth since 2010. Germany is Europe’s top filing country and showed +4.7% growth in 2018, alongside solid growth from UK, Switzerland, Sweden, Denmark and Belgium. Proof that Europe is an attractive market for innovation and investment.
This is great news – but as China’s funding for science and research reaches 2.5 per cent of GDP in 2019, versus an average of 2% for EU-28 and just 1.7% for the UK – we should be planning how we can do better and remain competitive in years to come.
EU member states and indeed other governments worldwide increasingly use R&D incentives (tax credits, grants, loans, government procurement mechanisms…), to stimulate business investments in R&D. This boosts productivity and economic growth. Of course the socio-economic basis of R&D funding is wide-ranging. Incentivising R&D goes hand-in-hand with promoting a strong academic foundation. This creates and maintains skilled jobs, encourages business investment in R&D and increases new products and services on the market. Additionally it joins the dots with policy to continue stimulation – a virtuous cycle.
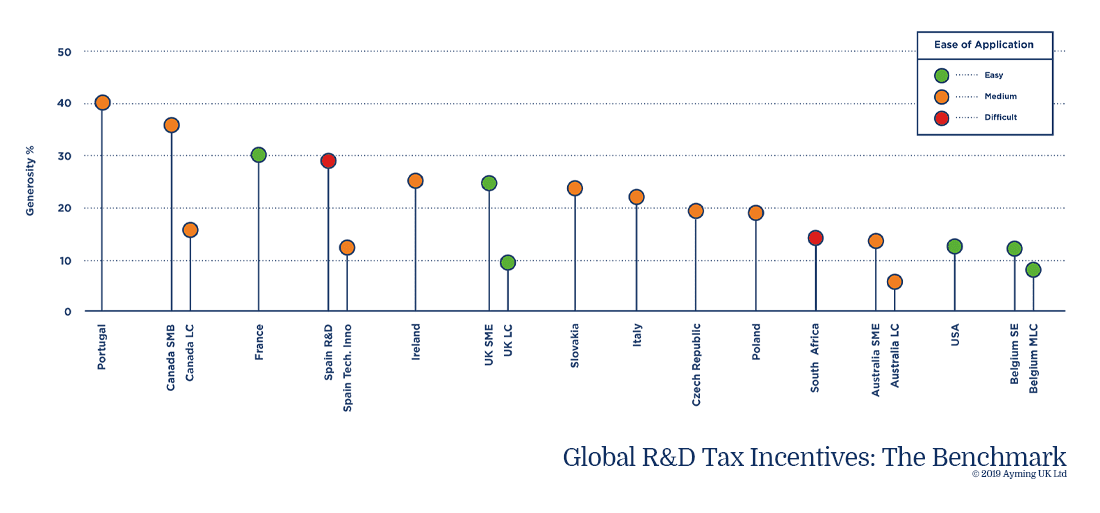
Ayming’s analysis of global tax credit incentives, The Benchmark, shows that whilst the R&D tax mechanism is wide spread around the world, the way each country implements the incentive varies hugely.
Until now, Germany has not implemented tax incentives for research & development, preferring direct aid – but this is about to change. In 2020, Germany proposes to implement a 4-year R&D tax mechanism, a €5 billion boost for business R&D, limiting to €500k of tax credit per company. It will be interesting to see what the patent application figures look like for Germany by 2025, when they give a further boost to business R&D.
The UK is an innovation leader but…
The UK already provides diverse funding mechanisms for innovative companies via grants, loans and tax incentives. But benchmarked against other top innovation performers, it could be said that the UK sits in the middle ground of R&D tax incentives. Yes – it’s beneficial, yes – it’s relatively easy to apply, but our system actually provides a fairly standard, vanilla flavoured mechanism.

Figure 1: Ranking of Global R&D Tax Incentives by Generosity. Data source: Ayming UK 2019
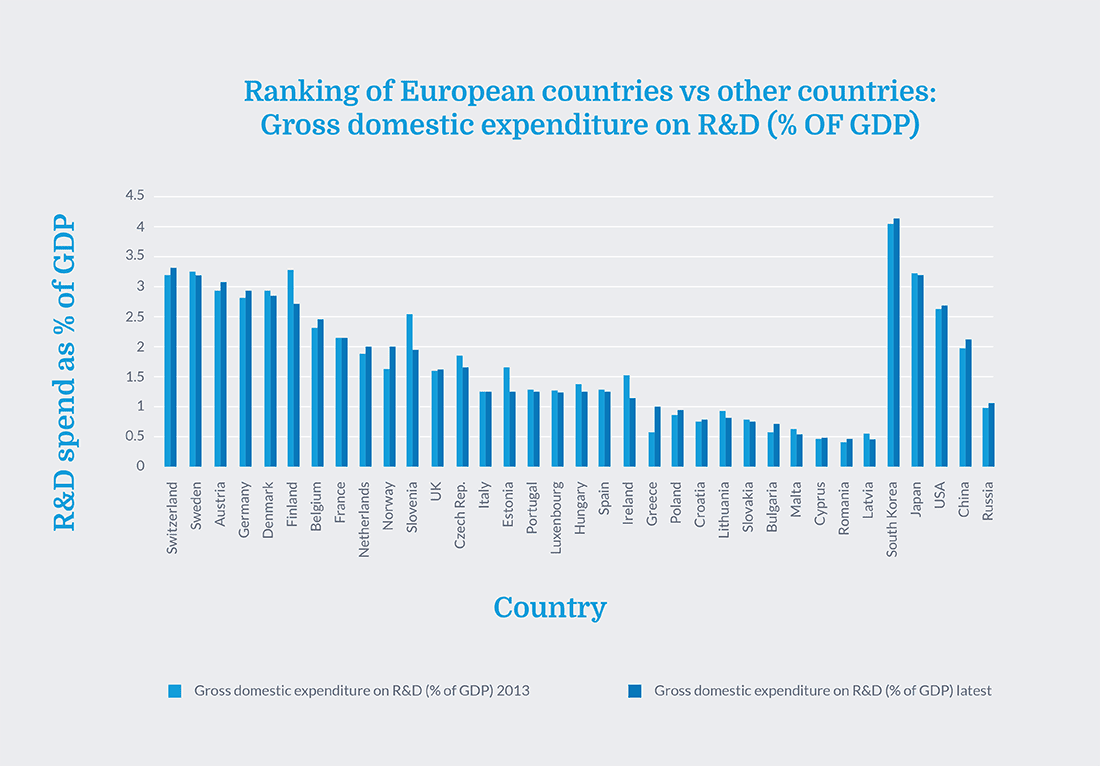
While the UK is generally seen as being a relatively easy and accessible R&D tax credit system, according to ONS figures the UK remains in just 11th place out of the EU-28 member states for intensity of investment in R&D as a proportion of GDP. In 2017, total UK R&D expenditure was 1.69% of GDP, but remaining below the EU-28 forecast of 2.07%. As an illustration of actual spend, compare the UK spend of £3.5 billion on R&D tax incentives in 2016-2017, compared with France’s annual spend of around €6 billion.

Figure 2: Ranking of European countries vs other countries: Gross domestic expenditure on R&D (% of GDP). Data source: European Innovation Scoreboard 2018
At policy level, it is time for the UK to actively improve and, dare we say it, innovate with the R&D tax incentive schemes. Although European-wide regulations do exist to maintain a level playing field, there are already massive differences between EU-28 implementation of R&D tax incentives. When you look at the variety of schemes and cost categories that exist worldwide – there is clearly room for each country to innovate and adapt their own, home-grown policy.
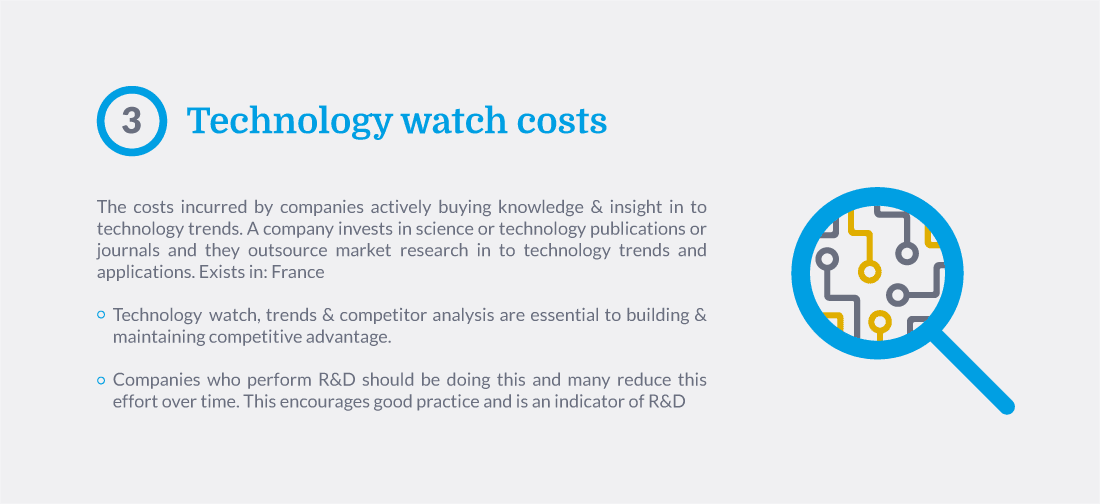
France is a fantastic example of this. As one of the first countries to implement an R&D tax incentive in 1983 – France has included a number of additional cost categories to its qualifying expenditure baseline. Here we can cite ‘Young doctors’ – where a PhD graduate salary counts double, when their first full-time employment is in a company doing R&D.
Boosting R&D incentives – loads more money or a bit more money in the right places?
There is a school of thought that suggests purely increasing the percentage benefit of R&D tax credits would automatically boost the incentive effect. This opens up many macroeconomic questions about value for money, GDP (gross domestic product), and use of public cash versus longer term impacts.
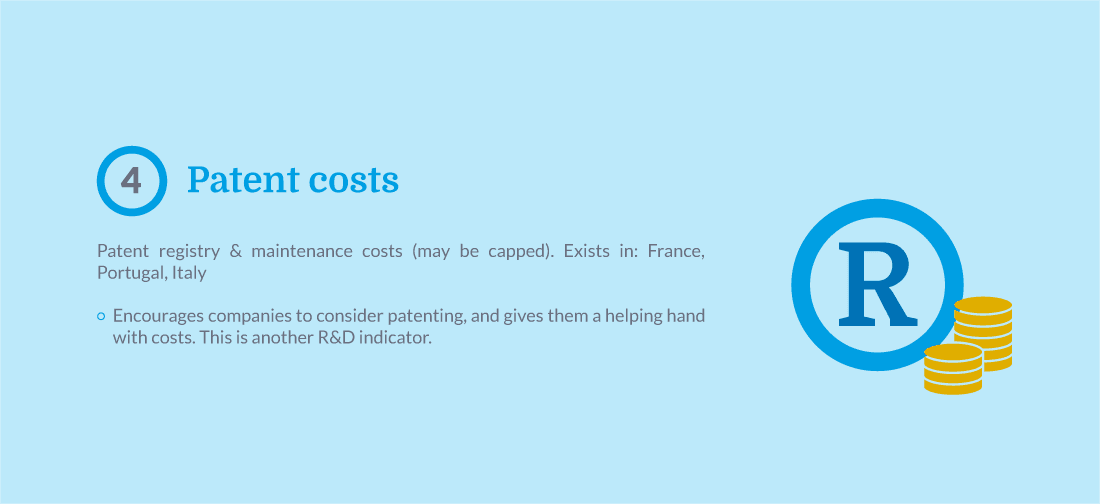
On the other hand, perhaps there is greater value for money to be found in adding a more diverse range of differentiating cost categories, to the qualifying expenditure baseline. It is easy to write off these cost category adaptations as ‘too small to make a difference’ or ‘too expensive to implement’. But the positive knock on effects are potentially huge and far reaching. Indeed, these knock on effects can stimulate UK growth and value in other ways. For example bridging gaps to create and maintain skilled R&D jobs, or encouraging patenting and joining dots with regional policy to continue stimulation of business-led innovation & investment. A truly virtuous cycle.
The EU Innovation Scoreboard 2018 notes that the UK’s weakest dimensions are intellectual assets, company investment and innovation-friendly environment. Here are 5 concrete ways the UK can differentiate its R&D tax incentive scheme, to further improve and link the innovation landscape.
Five concrete ways the UK can differentiate its R&D tax incentive scheme to further improve and link the innovation landscape.


Wherever R&D tax incentives are implemented all over the world, they are rightly complementary to other measures of public support for business R&D. And although R&D tax incentives can stimulate business investment in R&D, innovation and productivity, we also know that how the scheme is designed, administered and implemented are crucial to overall effectiveness.
As we’ve seen here, integrating a few well-chosen differentiating elements to the UK R&D tax scheme, could bring far-reaching advantages to our funding landscape and boost our Innovation Nation, as an even more attractive place to do business.


